今日推薦開源項目:《綠色保護著我前進 atree》
今日推薦英文原文:《Statistics for Data Scientists in 5 mins》

今日推薦開源項目:《綠色保護著我前進 atree》傳送門:GitHub鏈接
推薦理由:一棵遲來的聖誕樹!只要在心裡給它加上裝飾的確可以成為一棵聖誕樹。如果有興趣的話可以看看作者提供的代碼,興許可以在農曆新年裡自己也實現一個。雖然有點遲了狂歡夜都過了,不過不管怎麼說,聖誕快樂!

今日推薦英文原文:《Statistics for Data Scientists in 5 mins》作者:Diva Jain
原文鏈接:https://towardsdatascience.com/statistics-for-data-scientists-f2456d26c5a5
推薦理由:猴子也看不懂的關於數據統計方面的一些知識,在以後分析數據的時候可能用得上
Statistics for Data Scientists in 5 mins
「Facts are stubborn things, but statistics are pliable.」― Mark Twain Photo by Mike Kononov on Unsplash
Population parameter vs. Sample Statistics
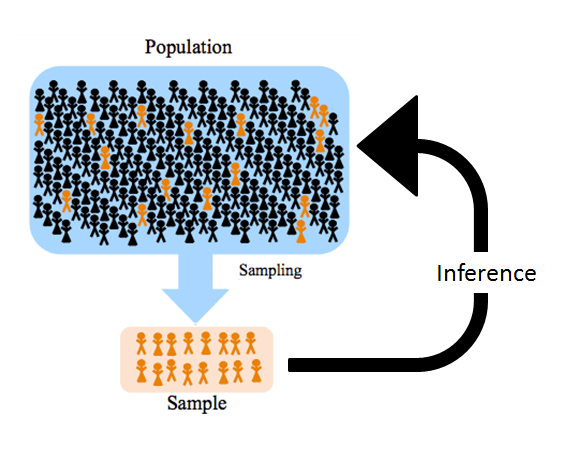
The goal of the researcher is not to draw conclusions about the sample but to draw conclusions about the population from the provided sample. Thus researchers must use statistics on the sample to infer about the values in the population. These values in the population are called parameters. Parameters are the unknown characteristics of the entire population, like the population mean and median. Sample statistics describe the characteristics of a fraction of population which, is taken as the sample. The sample mean and median is fixed and known.
Sampling Error
Suppose, I have 3000 people who go for a morning walk in a park. I can get their average weight and population mean, which is an exact representation of the average height. In practice, calculating true mean is not viable every time. Therefore, we will take a portion of the total population of 3000, i. e., 1000. If the sample is chosen at random rather than observed, then the expected mean is similar to the true mean. However, as it is a random sample, the mean could vary from true mean. The difference between the sample mean and the true meaning is known as sampling error.
Standard Error
It refers to the standard deviation of all the means. It shows how much the values of the mean of a bunch of samples differ from one another.
Suppose, we want to observe how much sale occurs in 3 days. By taking means of sales each day, we can get the average sales. However, there are many external factors that influence sales, like, discounts, holidays, etc. Thus, instead of taking the mean of one day, we take means of 3 days.
The Standard Error of the means now refers to the change in the mean with different observation each time.
If we measure multiple samples of a dataset, means won』t be same and will spread. SE of samples is the standard deviation of the sample means and gives us a measure of the spread.
Confidence Interval & Confidence Level

「According to a survey, the oranges in the orchard with a 96% level of confidence weighs between (132–139 gm)」.
(132–139 gm) is the confidence interval. It is a range of values within which the true value lies. CI is used to express the range in which we are sure the population parameter lies. Whenever we want to express an estimate of a population parameter, it is a good practice to state its CI. The width of CI tells us a lot about certainty we have about the population from the collected sample. When you don』t know much about the population』s behaviour, you need to use t-distribution to find the Confidence Interval.
96% confidence level means that if the survey or polls were to be repeated with the same conditions, over and over again, the results of the survey would match the results from the actual population 96% of the time.
Two things which affect CI is Variation and Sample Size:-
Variation: If all the values in the population were similar, then the sample would have little variation. Every sample of the population would be similar to each other.
Low Variation causing Similar Samples causing Narrow CI
High Variation causing Varied Samples causing Wider CI
Sample Size: If we take small samples, we don』t have many findings to base our inference upon. Small samples will differ from one another, and have less detail, leading to wider CI
Large sample size causing more details causing Narrow CI
Small sample size causing fewer details causing Wider CI
Margin of Error
Surveys are based on facts collected from a sample, not the entire population. Some amount of error is bound to occur as we have to infer real statistics based on samples, like sampling error, which occurs because everyone isn』t taken into account. The margin of error is supposed to measure the maximum amount by which the sample results are expected to differ from those of the actual population. It measures accuracy, not the amount of bias.
margin of error = critical value * standard error
Example: We know 49% will vote for Mrs Dix in the elections, with a margin of confidence +/-2. This means I am confident that between 47%(49%-2%) and 51%(49%+2%) of the population will vote for her.
Hypothesis Test
The main purpose is to test the results of surveys and polls to check if the results were meaningful and repeatable and not random. It is whether we can accept or reject a claim using statistics. It examines two claims about the population. Example: The drug for a headache will not be effective, or will the height of female and male students differ? Generally, the statement is in the form of 「If (do this to an independent variable), then(this will happen to the dependent variable)」.
Null and Alternative Hypothesis
The null hypothesis (H0), is usually the hypothesis that sample observations result purely from chance. It is the fact that is commonly known. Researchers work to reject it. The idea is that there is no relationship and whatever is being reflected in the result of sampling error. It proposes that no statistical significance exists in a set of given observations.
The alternative hypothesis (H1 or Ha), is the hypothesis that sample observations are influenced by some non-random cause. The idea is that the relationship in the sample reflects the relationship in the population. Example:
H0: Earth is flat. There exists a relationship between the population and Ha.
Alternate Hypothesis: Earth is round
Type I and Type II Error
Type I Error means rejecting the True null hypothesis and accepting the alternate hypothesis. It is a false positive. A smoke detector detecting smoke when there is no smoke.
Type II Error means accepting the null hypothesis when an alternate hypothesis is true. It is a false negative. When fire alarm fails to detect fire.
Alpha and Beta Level
z indicates the alpha level in a two-tailed test
Alpha level is also known as the significance level, α. It is the probability of making the wrong decision,i.e., rejecting the null hypothesis when it is true. Low alpha levels mean that we need strong evidence to be able to reject the null hypothesis. This means that alpha level of 1% requires more statistical evidence than 5%.
Why is 5% used as significance level so commonly?
The smaller the alpha level, the little is the chance to reject True Null hypothesis. And, also the smaller is the chance to reject the False null hypothesis, because of the tiny area. The more you try to avoid Type I Error, the more you are likely to make a Type II Error.A confidence level is 1- α, which means accepting the null hypothesis when it is True.
Beta level means the probability of making a Type II Error, i.e., rejecting the Alternate hypothesis when it is True.
P-Value
It is used by all the hypothesis testing to check the strength of the evidence provided by the population in form of data. It is the evidence against the null hypothesis. The value is between 0 and 1:
A small p-value ( ≤ 0.05) indicates strong evidence against the null hypothesis, so you reject the null hypothesis. It means that the sample results aren』t consistent with the null hypothesis that is true.
A large p-value (> 0.05) indicates weak evidence against the null hypothesis, therefore you fail to reject the null hypothesis. It means that the sample results are consistent with a null hypothesis that is true.
If the p-value is less than or equal to the alpha level, we reject the null hypothesis.
下載開源日報APP:https://openingsource.org/2579/
加入我們:https://openingsource.org/about/join/
關注我們:https://openingsource.org/about/love/