每天推荐一个 GitHub 优质开源项目和一篇精选英文科技或编程文章原文,欢迎关注开源日报。交流QQ群:202790710;微博:https://weibo.com/openingsource;电报群 https://t.me/OpeningSourceOrg

今日推荐开源项目:《复制粘贴回车一气呵成 TinyEditor》传送门:GitHub链接
推荐理由:今天我们来讲编辑器,JSCSSHTML 最小的编辑器是什么?Tiny。TinyEditor,坐。整个大小不到 400 kb,JSCSSHTML 一应俱全,要启动的话复制粘贴回车一气呵成按下即可启动,是编辑器中的豪杰。

今日推荐英文原文:《11 Javascript Data Visualization Libraries for 2018》作者:Jonathan Saring
原文链接:https://blog.bitsrc.io/11-javascript-charts-and-data-visualization-libraries-for-2018-f01a283a5727
推荐理由:JS 数据可视化库,如果你以为它们只是图表就大错特错了,其中有一些看起来就非常酷炫的……高级图表和不是图表的其他玩意,如果想要用更酷炫的方法展示数据的话可以考虑看看这个
11 Javascript Data Visualization Libraries for 2018
We live in an era of data explosion, when nearly every application we develop uses or leverages data to improve the experience delivered to the users.
Sometimes, the best feature we can deliver to our users is the data itself. However, table and number charts are often tiring to read and it can be hard to draw actionable insights from large data tables.
Instead, we can use neat data visualization methods that leverage the brain’s ability to identify and process data in a visual way. To help you get started and easily add beautiful data visualization to your favorite application, here are some of the best Javascript data visualization libraries around in 2018 (unranked). Feel free to comment and add your own suggestions and insights!
Tip: We use some of these libraries for various applications, using Bit (GitHub) to share and sync reusable components in different apps and project. Feel free to try these libraries with or without Bit for yourself.
1. D3js
At 80k stars D3.js is probably the most popular and extensive Javascript data visualization library out there. D3 is built for manipulating documents based on data and bring data to life using HTML, SVG, and CSS. D3’s emphasis on web standards gives you the capabilities of modern browsers without coupling to a proprietary framework, combining visualization components and a data-driven approach to DOM manipulation. It allows you to bind arbitrary data to a Document Object Model (DOM), and then apply data-driven transformations to the document. Here’s a great example gallery.
Note: some say D3 isn’t a data visualization library at all… 🙂
2. ChartJS
An extremely popular (40k stars) library of open source HTML 5 charts for responsive web applications using the canvas element. V.2 provides mixed chart-types, new chart axis types, and beautiful animations. Designs are simple and elegant with 8 basic chart types, and you can combine the library with moment.js for time axis. You can also check out the library on cdnjs.
3. ThreeJS
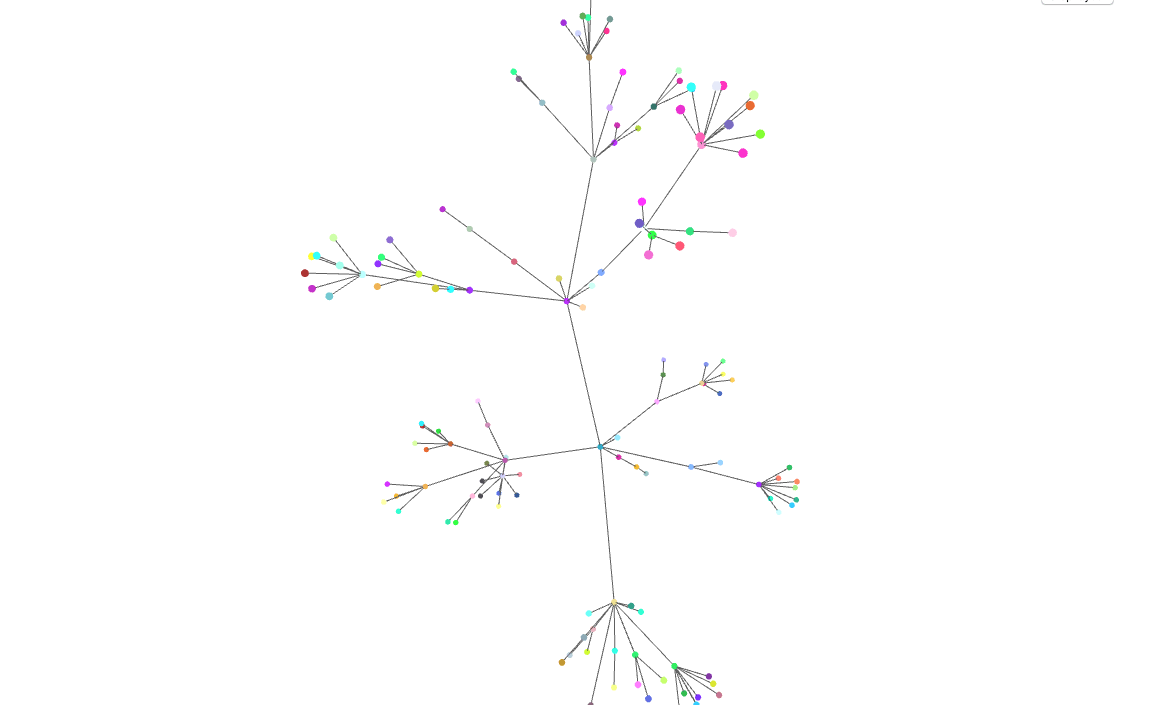
This incredibly popular library (45K stars; 1K contributors) in built for creating 3d animations using WebGL. The project’s flexible and abstract nature means it’s also useful for visualizing data in 2 or 3 dimensions. For example You can also use this designated module for 3D graph visualization with WebGL, or try this online playground. Interesting choice to consider.
4. Echarts & Highcharts
Baidu’s Echarts project (30k stars) is an interactive charting and visualization library for the browser. It’s written in pure JavaScript and is based on the zrender canvas library. It supports rendering charts in the form of Canvas, SVG (4.0+), and VML In addition to PC and mobile browsers, ECharts can also be used with node-canvas on node for efficient server-side rendering (SSR). Here’s a link to the full example gallery, where each example can be played with (and themed) in an interactive playground.
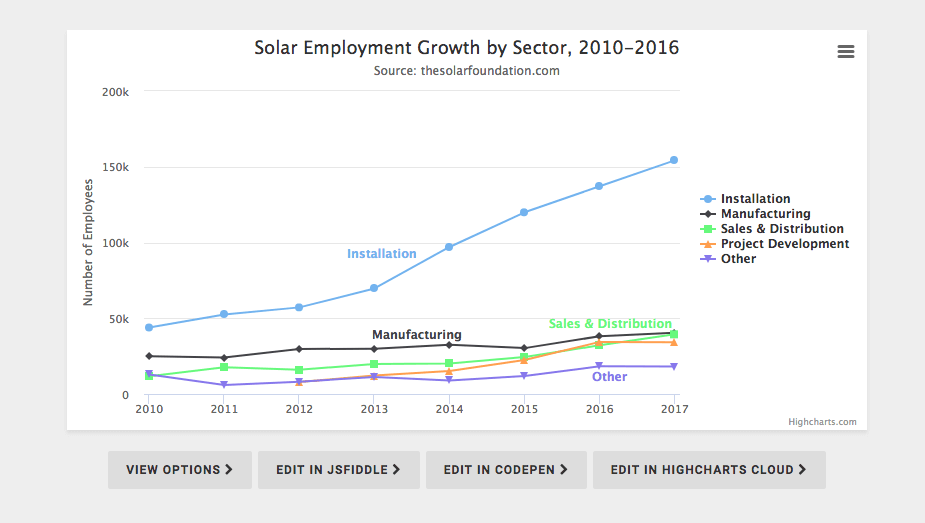
Highcharts JS is a 8K stars and widely popular JavaScript charting library based on SVG, with fallbacks to VML and canvas for old browsers. It claims to eb used by 72 out of the world’s 100 largest companies, which makes it (probably) the most popular JS charting API in the world (Facebook, Twitter).
5. Metric-Graphics
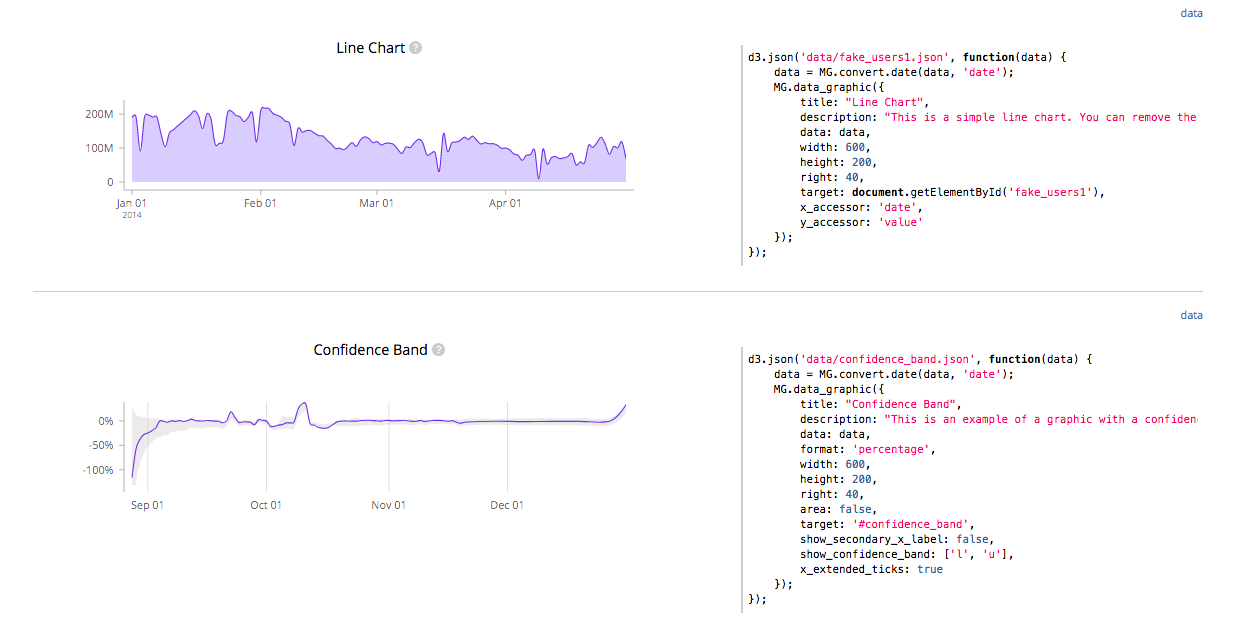
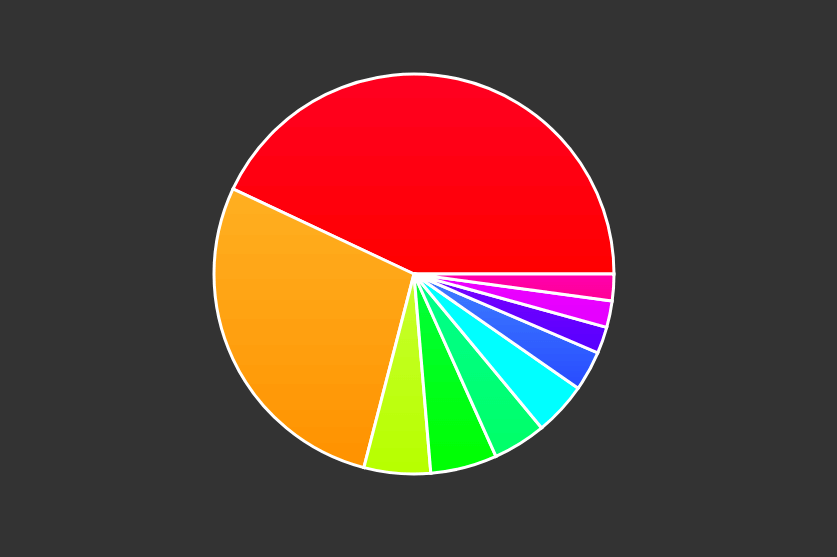
MetricsGraphics.js (7k stars) is a library optimized for visualizing and laying out time-series data. It’s relatively small (80kb minified), and provides a narrow yet elegant selection of line charts, scatterplots, histograms, bar charts and data tables, as well as features like rug plots and basic linear regression. Here’s a link to an interactive example gallery.
6. Recharts
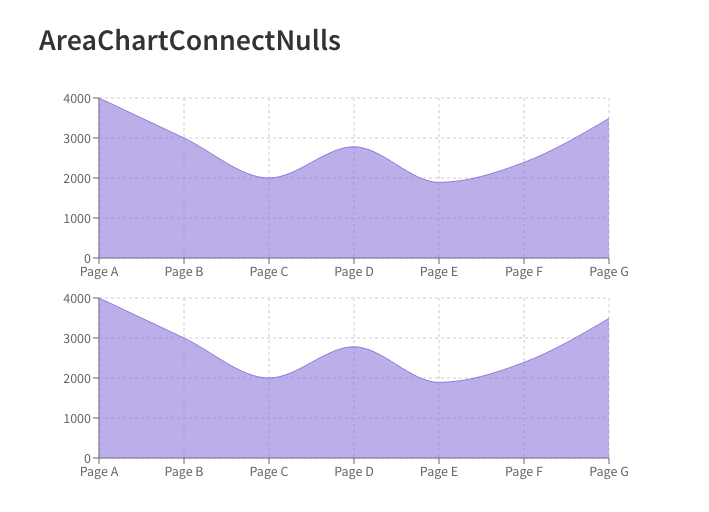
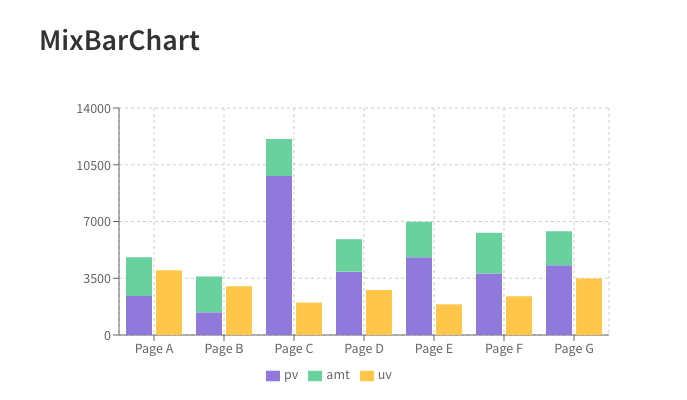
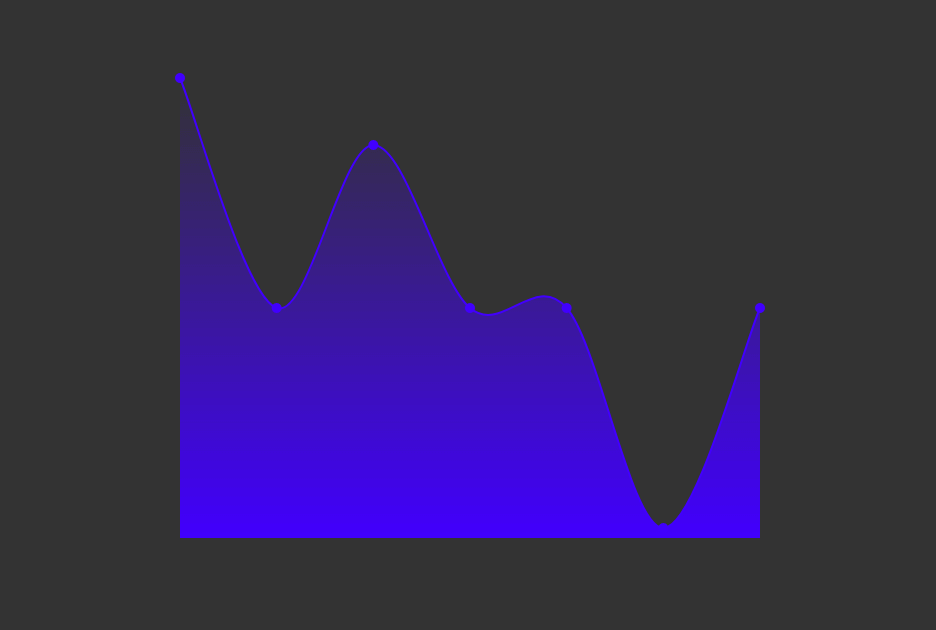
Recharts is a chart library build with React and D3 that lets you deploy as declarative React components. The library provides native SVG support, lightweight dependency tree (D3 submodules) is highly customizable via component props. You can find live examples in the docs website.
7. Raphael
A 10k stars Javascript “vector library” for working with vector graphics in the web. The library uses the SVG W3C Recommendation and VML as a base for creating graphics, so every graphical object is also a DOM object and you can attach JavaScript event handlers. Raphaël currently supports Firefox 3.0+, Safari 3.0+, Chrome 5.0+, Opera 9.5+ and Internet Explorer 6.0+.
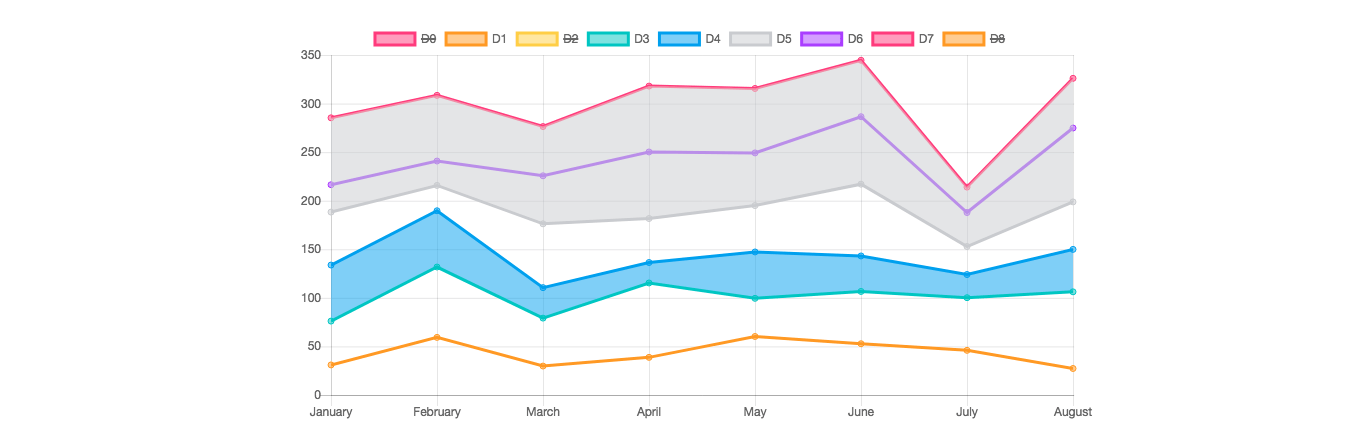
7. C3js
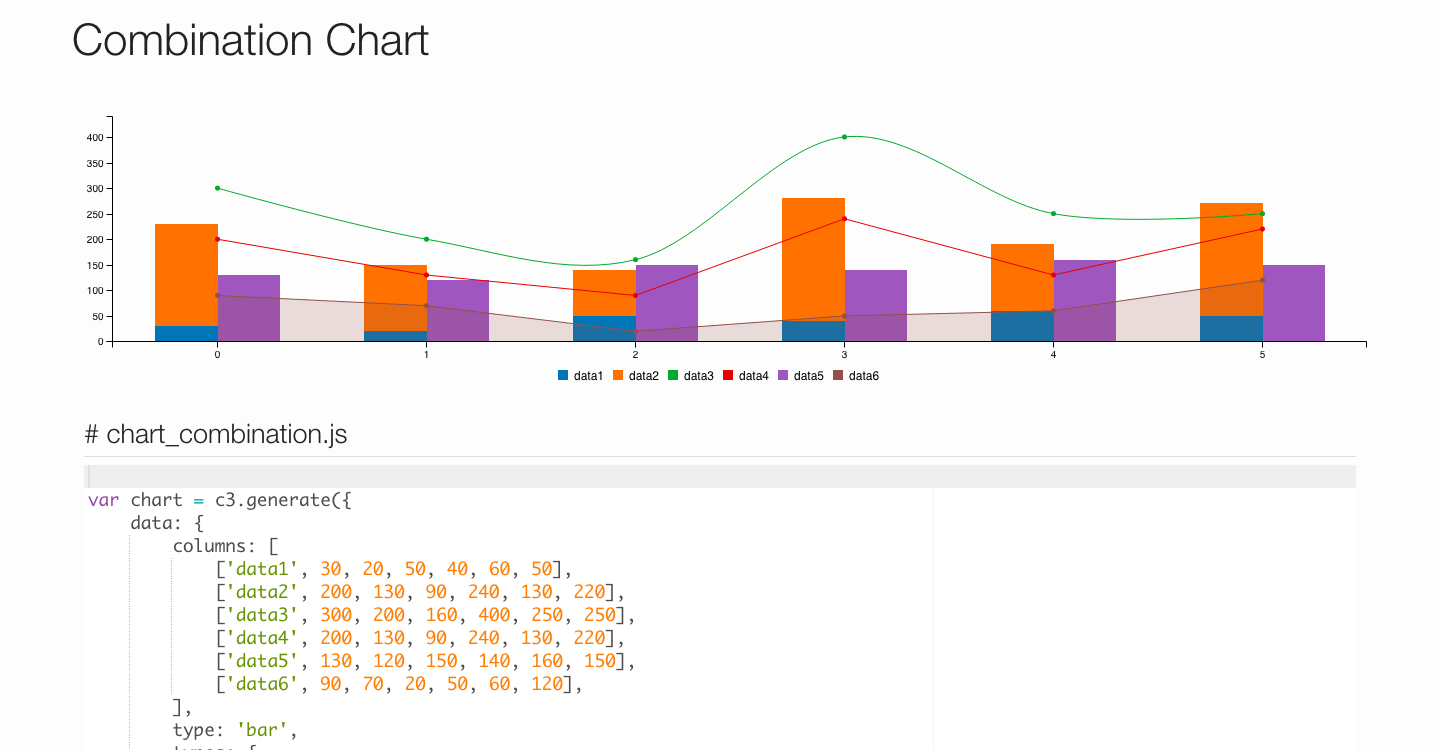
At 8k stars C3 is a D3-based reusable chart library for web applications. The library provides classes to every element so you can define a custom style by the class and extend the structure directly by D3. It also provides a variety of APIs and callbacks to access the state of the chart. By using them, you can update the chart even after it’s rendered. Take a look at these examples.
8. React Virtualized + React Vis + Victory
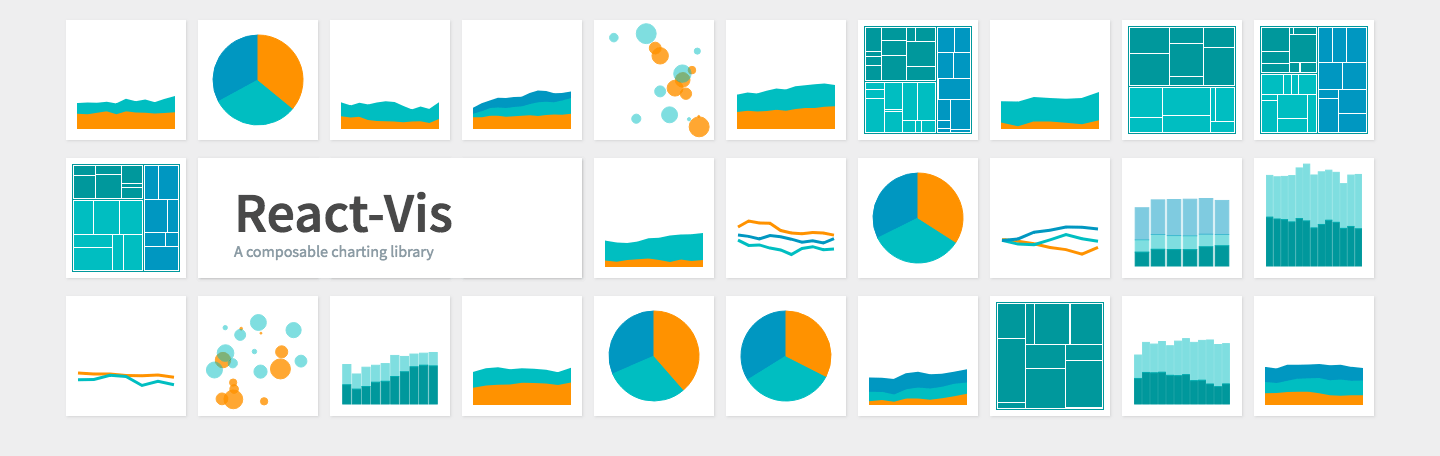
React-vis (4k stars) is Uber’s set of React components for visualizing data in a consistent way, including line/area/bar charts, heat maps, scatterplots, contour plots, hexagon heatmaps and much more. The library does not require any previous knowledge with D3 or any other data-vis library, and provides low-level modular building-block components such as X/Y axis. A great match for working with Bit and a very useful library to consider.
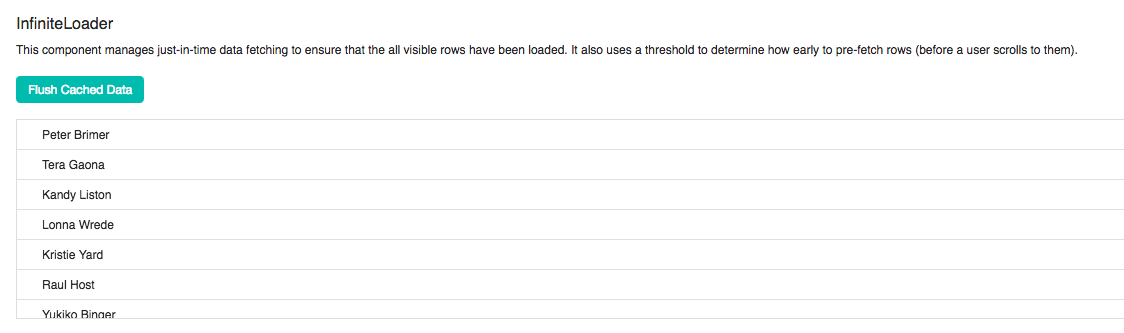
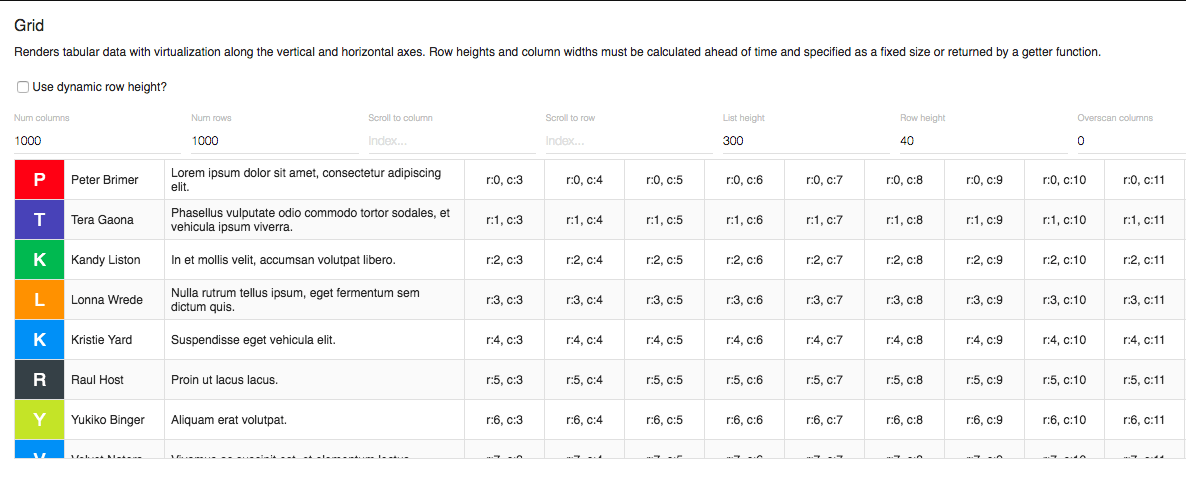
React virtualized (12k stars) is a set of React components for efficiently rendering large lists and tabular data. ES6, CommonJS, and UMD builds are available with each distribution and the project supports a Webpack 4 workflow. Note that react, react-dom must be specified as peer dependencies in order to avoid version conflicts. Give it a try.
Victory is a collection of React composable React components for building interactive data visualization, built by Formidable Labs and with over 6k stars. Victory uses the same API for web and React Native applications for easy cross-platform charting. An elegant and flexible way to leverage React components in favor of practical data visualization. I like it.
These libraries is a neat combination with Bit when using individual components, to share and sync them across apps.
9. CartoDB
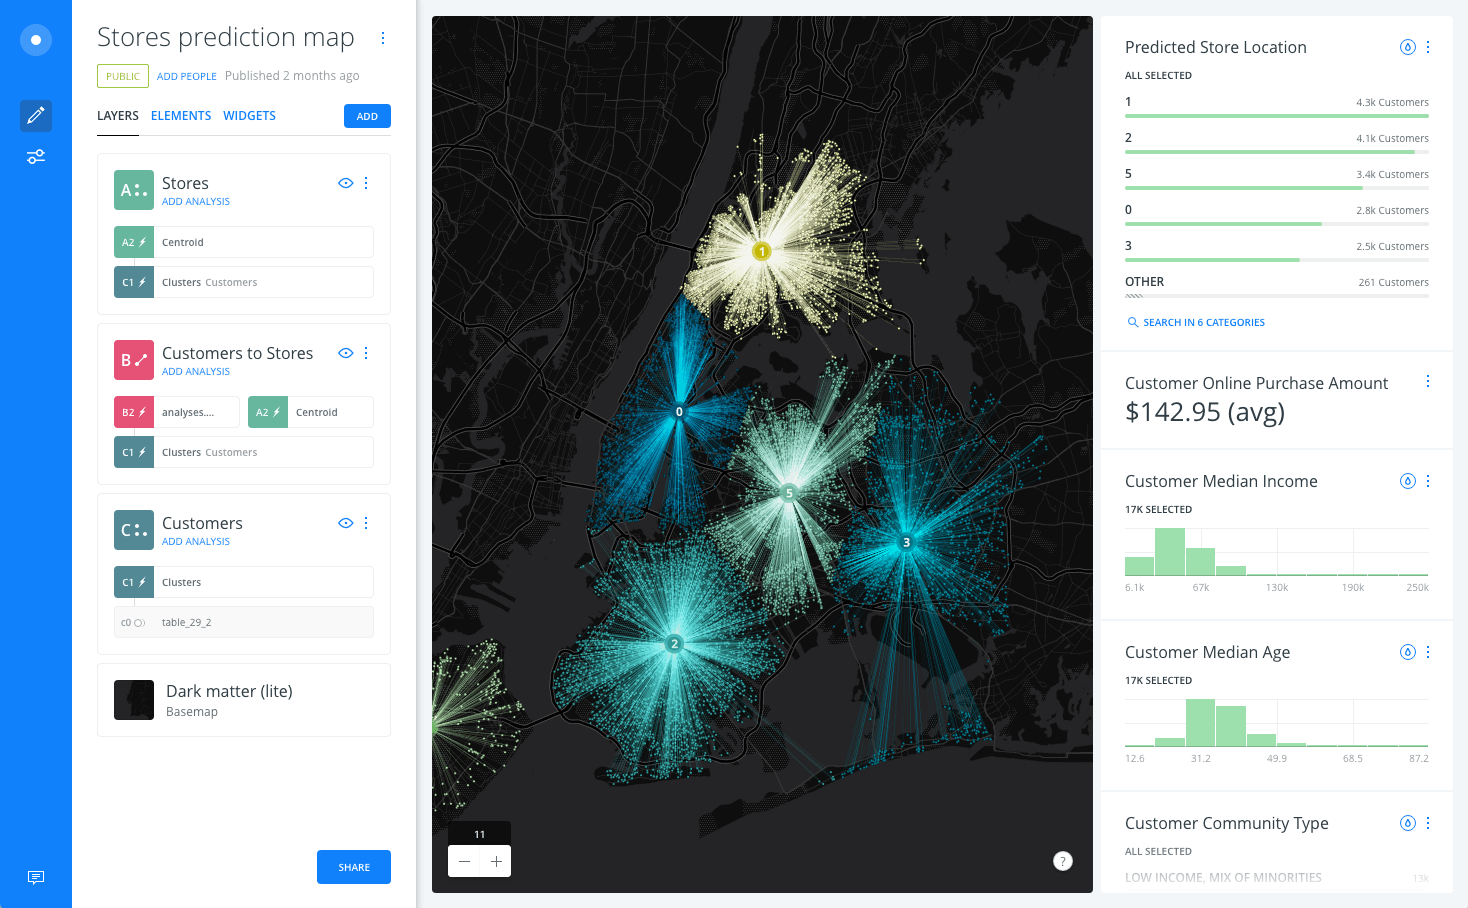
At 2k stars Carto is a Location Intelligence & Data Visualization tool for discovering insights underlying location data. You can upload geospatial data (Shapefiles, GeoJSON, etc) using a web form and visualize it in a dataset or on a map, search it using SQL, and apply map styles using CartoCSS. Here are a bunch of video demos to help you get the idea and get started.
10. Raw graphs
At over 5K stars Raw is a connection link between spreadsheets and data visualization built to create custom vector-based visualizations on top of the d3.js library. It works with tabular data (spreadhseets and comma-separated values) as well as with copied-and-pasted texts from other applications. Based on the SVG format, visualizations can be edited with vector graphics applications for further refinements, or directly embedded into web pages. Here’s an example gallery to explore before diving in.
11. Metabase
At over 11k stars Metabase is a rather quick and simple way to create data dashboards without knowing SQL (but with SQL Mode for analysts and data pros). You can create canonical segments and metrics, send data to Slack (and view data in Slack with MetaBot) and more. Probably a great tool to visualize data internally for your team, although some maintenance might be required.
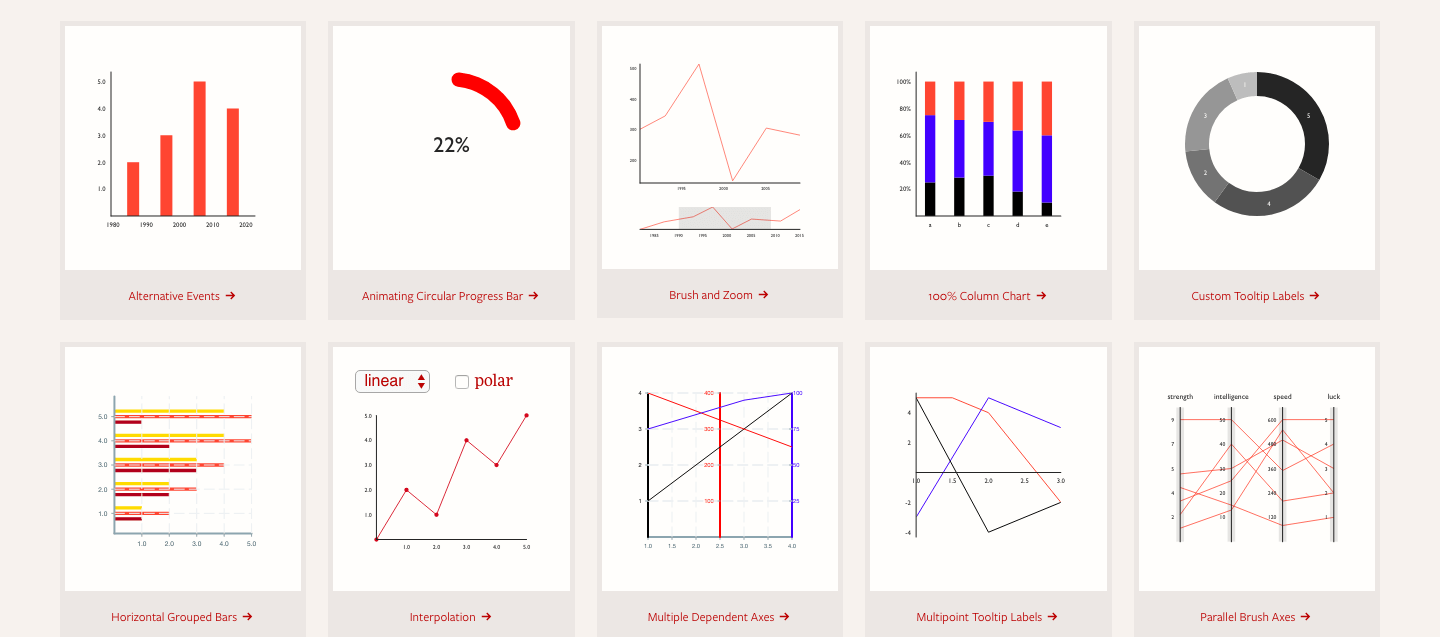
Bonus: tauCharts
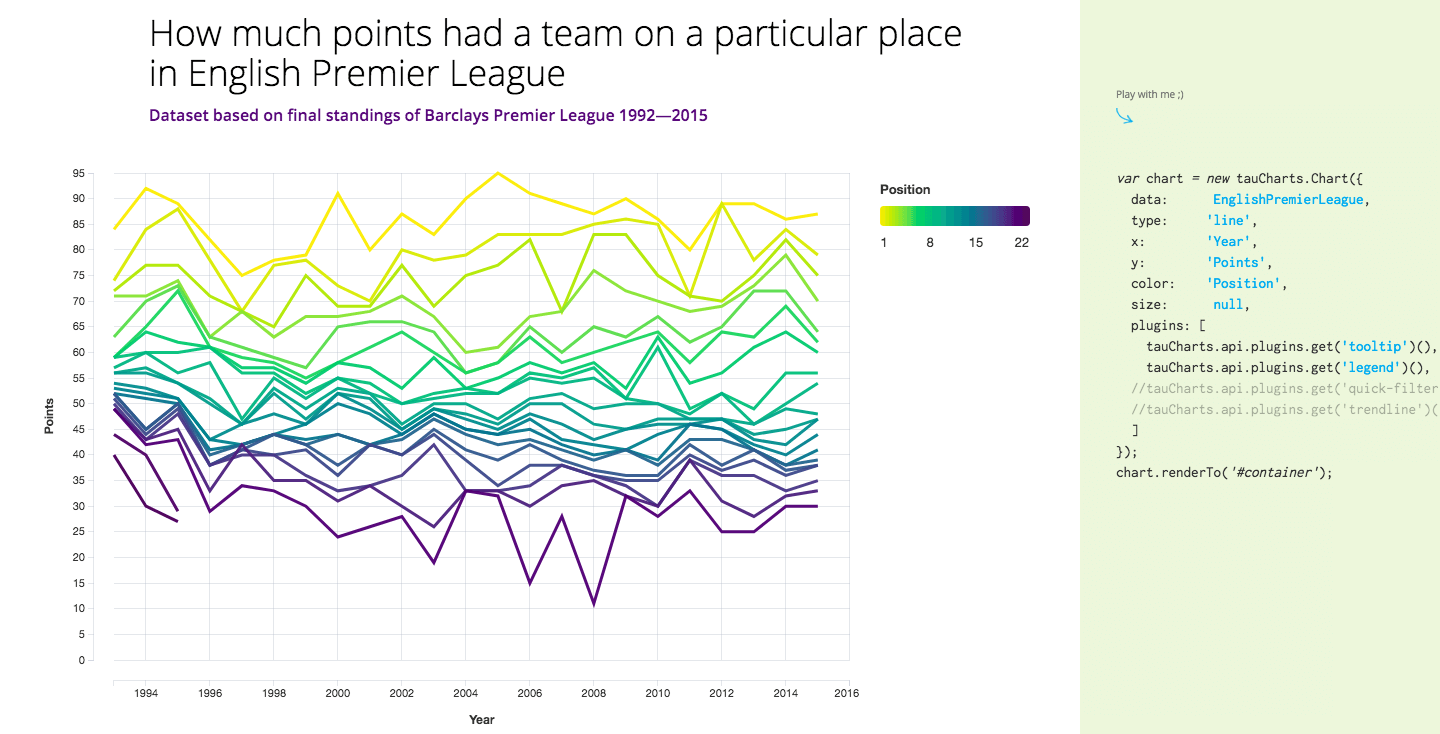
At nearly 2k stars tauCharts is a D3-based and data-focused charting library. The library provides a declarative interface for fast mapping of data fields to visual properties, and its architecture allows you to build facets and extend chart behavior with reusable plugins. It also looks pretty good, right?
Honorable mentions
Note that some of these are unmaintained.
Learn More
每天推荐一个 GitHub 优质开源项目和一篇精选英文科技或编程文章原文,欢迎关注开源日报。交流QQ群:202790710;微博:https://weibo.com/openingsource;电报群 https://t.me/OpeningSourceOrg

One of our guests just lately encouraged the following website.
Very handful of web-sites that happen to be comprehensive beneath, from our point of view are undoubtedly very well really worth checking out.