今日推荐开源项目:《面试手书 tech-interview-handbook》
今日推荐英文原文:《What are the Happiest Jobs in Tech?》
今日推荐开源项目:《面试手书 tech-interview-handbook》传送门:GitHub链接
推荐理由:一个关于面试的指南项目。这个项目包括了面试中的技术部分——比如随处可见的各种算法,你肯定会在技术面试里或多或少的见到它们;以及技术以外的技巧,包括自我介绍的要诀,如何表现自己等等。要想成功赢下一场面试,足够的技术力自然必不可少,但当你具备了足够的硬实力之后,如何最大化的在面试里发挥它们就同样显得十分重要。
今日推荐英文原文:《What are the Happiest Jobs in Tech?》作者:A Samuel Pottinger
原文链接:https://towardsdatascience.com/what-are-the-happiest-jobs-in-tech-4c4d33e065f0
推荐理由:开心和钱在工作中往往不太好兼得呢……
What are the Happiest Jobs in Tech?
The technology sector sees some of the highest salaries but also some of the highest turnover rates [1][2]. When investigating this competitive but high attrition ecosystem, discussion often turns to how job satisfaction differs by company and how retention varies between employers [3][4]. However, the focus on company ignores the fact that tech houses not just a multitude of corporations but also a diversity of people with different priorities and relationships to their interconnected fields of work. Investigating how experience varies by discipline, the 2019 Stack Overflow Developer Survey can help contextualize job satisfaction through field of work, compensation, and other factors to reveal not just who is most highly compensated but also who is most satisfied and what helps them find happiness at work [5].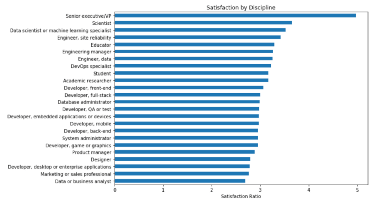
Satisfaction ratios by “discipline” (devType from the 2019 Developer Survey). Senior executives report high satisfaction while data analysts exhibit relatively low satisfaction.
To start, satisfaction does vary between disciplines. More specifically, the data show a statistically significant difference between fields of work given number of people indicating they are satisfied with their job versus the number indicating dissatisfaction (p < 0.05). Consider a metric which divides the number of people who report being satisfied (slightly or very satisfied) by the number dissatisfied (slightly or very unsatisfied) with their job. Using that “satisfaction ratio” metric to rank the fields of work within the Stack Overflow Developer Survey, four groups dominate the top ten most satisfied: management (executives and, to a lesser extent, engineering management), science (including data science), reliability (SRE and DevOps), and academia (educator and researcher). The data also show that most of the “developer” roles sit around the median value of 3.0 and, below that, one finds designers, PM, sales / marketing, and analysts.
One might suspect that compensation could account for this disparity in fields of work and, indeed, those reporting satisfaction with their jobs saw significantly higher salaries than those reporting dissatisfaction (difference of ~$21k difference, p < 0.05). Even still, consider that compensation may not be fully capturing variation in satisfaction. Though it can be a troublesome metric, linear regression on median discipline compensation only “explains” about a third of the variance in discipline satisfaction ratio (R² = 0.29) [6][7]. Looking closer at the data, one can begin to see the fields of work that challenge that important but complicated relationship. For example, academic researcher yields low compensation compared to an engineering manger but both still report fairly similar high satisfaction ratios. Likewise, engineering managers, data scientists, and SREs may see a notable difference in pay but not necessarily a huge difference in satisfaction. Of course, if one is looking to optimize satisfaction and pay, one may consider senior executive / VP, SRE, or engineering manager. Still, while money might help, it doesn’t always seem to buy added happiness.
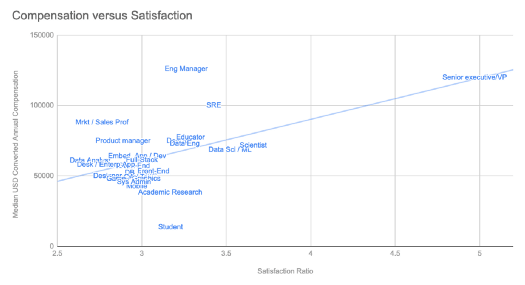
Median compensation and satisfaction ratios for different devTypes.
If compensation may not fully explain satisfaction in this sample, what else might be important within the tech landscape? The Developer Survey asks respondents about factors that might influence their decision to take a job (“… deciding between two job offers with the same compensation, benefits, and location … which 3 are [most] important to you?”) and, interestingly, there is a statistically significant difference in the frequency with which factors are selected by different disciplines (p < 0.05). Notably, developers of various kinds (front end, back end, etc) rank “[l]anguages, frameworks, and other technologies [they would] be working with” at the top of their list whereas culture tops the lists of PM, engineering managers, sales / marketing, and data scientists / analysts. Interestingly, looking at high satisfaction disciplines, impact of one’s work for both scientists (including data science) and senior executives may matter more than usual. Regardless, like with compensation, this variable ranking of factors may imply that different types of people in tech are searching for different things from their jobs and many factors may be acting holistically to support satisfaction.
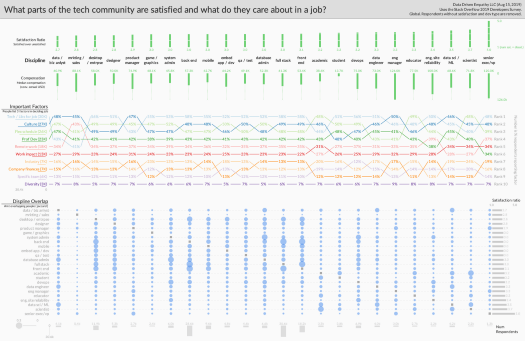
Visualization of satisfaction and job factors by discipline while also showing how those disciplines are inter-related. Full resolution image available here .
Finally, respondents to the Developer Survey often identify with more than one discipline and, by leveraging those “overlaps” in fields, one can begin to see “clusters” within the landscape of tech with different experiences. Specifically, using the Jaccard Index over shared respondents, there’s quite a bit of overlap between engineering management and senior executives (both of which see high pay and satisfaction ratios) [8]. Likewise, many “developer” fields are closely related (front-end, back-end, full stack, etc) while also seeing similar satisfaction ratios. That said, some disciplines highlight that a small shift within a cluster can yield a very different outcome. Most notably, data scientists and data analysts report profoundly different satisfaction ratios even though they share a large number of practitioners. Also consider that some reliability (DevOps and SRE) disciplines report higher satisfaction and pay than system administrators even though, in terms of people self-reporting, there may be a relatively large overlap between those fields. It may be that some in tech can serve in more than one role but which role they fall into can greatly influence their experience of their work.
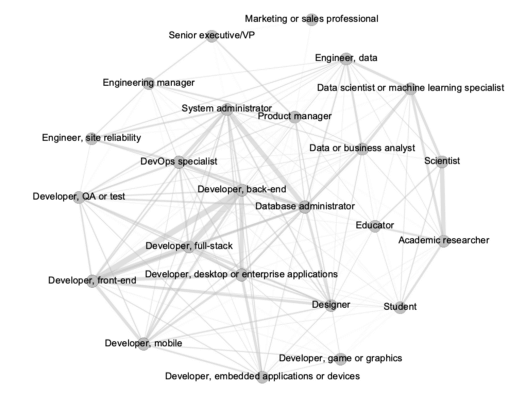
Relationships between different disciplines in tech using a Jaccard Index over respondents shared between different fields. Line width proportional to index with values under 0.05 filtered out.
While the technology sector is often discussed as one community, there are large variations in the experiences within tech and difference in what matters to its diverse members. Discipline is one important dimension that interacts with job satisfaction and not only can other factors beyond compensation count but the importance of those factors may vary depending on field of work. That said, while a student selecting a discipline or a practitioner looking to make a change may well consider the financial and emotional experiences of different fields, this essay also highlights lessons for someone else: managers and leaders. When building positions for different types of practitioners, it is worth emphasizing that different things matter to different types of people and, in an ever tightening tech labor market, a deeper understanding of those disciplines’ current reality may help one build better professional homes [9].
Code at https://github.com/sampottinger/dev_satisfaction.
Works cited
- Berger, Guy. “LinkedIn's 2017 State of Salary Report (U.S.) Introduction.” LinkedIn Jobs Blog, LinkedIn Corp, 2017, www.linkedin.com/jobs/blog/linkedin-2017-us-state-of-salary-report.
- Booz, Michael. “These 3 Industries Have the Highest Talent Turnover Rates.” LinkedIn Talent Blog, LinkedIn Corp, 15 Mar. 2018, business.linkedin.com/talent-solutions/blog/trends-and-research/2018/the-3-industries-with-the-highest-turnover-rates.
- Dickey, Megan Rose. “These Are the 15 Best US Tech Companies to Work for in 2019, According to Glassdoor.” TechCrunch, Verizon Media, 5 Dec. 2018, techcrunch.com/2018/12/04/these-are-the-15-best-u-s-tech-companies-to-work-for-in-2019-according-to-glassdoor/.
- Peterson, Becky. “Travis Kalanick Lasted in His Role for 6.5 Years - Five Times Longer than the Average Uber Employee.” Business Insider, Insider Inc, 20 Aug. 2017, www.businessinsider.com/employee-retention-rate-top-tech-companies-2017-8.
- “Stack Overflow Developer Survey 2019.” Stack Overflow Insights, Stack Exchange Inc, 2019, insights.stackoverflow.com/survey/2019.
- Ford, Clay. “Is R-Squared Useless?” Research Data Services + Sciences, University of Virginia Library, 17 Oct. 2015, data.library.virginia.edu/is-r-squared-useless/.
- Nau, Bob. “What’s a Good Value for R-Squared?” Statistical Forecasting, Duke University, people.duke.edu/~rnau/rsquared.htm.
- “Finding Similar Items.” Mining of Massive Datasets, by Jurij Leskovec et al., Cambridge University Press, 2016, pp. 73–74.
- McLaren, Samantha. “These Industries Will Face the Biggest Talent Shortages by 2030.” LinkedIn Talent Blog, LinkedIn Corp, 24 July 2018, business.linkedin.com/talent-solutions/blog/trends-and-research/2018/industries-biggest-talent-shortages-2030.
Code and other notes
The source code behind this essay and its visualization is made available at https://github.com/sampottinger/dev_satisfaction. Note that this uses a global sample from the 2019 Stack Overflow Developers Survey. Its numbers may differ from some metrics reported by Stack Overflow because it removes those that did not provide answers to all relevant questions. Specifically, consider the following that were removed:- Around 20% did not have satisfaction raiting available
- Around 8% did not have a developer type available
- Around 37% did not have compensation available
Other thanks
Some colors selected using http://colorbrewer2.org.下载开源日报APP:https://openingsource.org/2579/
加入我们:https://openingsource.org/about/join/
关注我们:https://openingsource.org/about/love/