今日推荐开源项目:《代码风格转换 prettier》
今日推荐英文原文:《Mapping Mars with AI》

今日推荐开源项目:《代码风格转换 prettier》传送门:GitHub链接
推荐理由:每个人写代码的风格都不一样,即使想办法统一了变量名函数名这些起名字的风格,代码的风格依旧会有所差异。但是现在可以试着改变这个情况了,这个项目能够格式化代码让它们具有一个比较容易阅读的风格,相信对于团队合作项目来说统一风格会相当管用。它不仅是通过换行来提高可读性,而且可以通过一些选项来改变细节部分——比如用制表符来进行缩进而不是空格,如果你的团队正困扰于代码风格的不同,这个项目会派上用场。
今日推荐英文原文:《Mapping Mars with AI》作者:Mark Wronkiewicz
原文链接:https://medium.com/devseed/mapping-mars-with-ai-590ec1c9cb11
推荐理由:靠着 AI 给火星画地图这事估计还是第一次有人干
Mapping Mars with AI
A pipeline to fully map the Red Planet
This blog post coincides with research that we’re presenting at the American Geophysical Union Conference on Dec 13th, 2018.
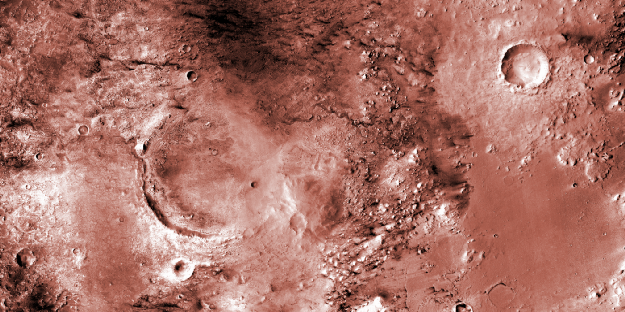
The exploration of Mars will require precise maps. Current feature maps for Mars are created by hand and therefore only include large features. Collaborating with researchers at Arizona State University, we used the YOLO deep learning architecture to autonomously detect surface features (here, craters) faster and at much finer scales. With assistance from Artificial Intelligence (AI), we can bring down the planet-wide mapping process from years to weeks.
Motivation
For much of history, explorers left home not knowing what they would encounter. Maps were so rare and valuable that explorers would employ spies to steal this geospatial information from rival nations. The first humans that venture to Mars will face ever-present hazards threatening their survival. We have the tools to make sure that the lack of an accurate map isn’t one of them.
Many surface features (e.g., craters, dunes, gullies, recurring slope lineae, etc.) are important to map for human and scientific exploration. We are working with ASU-based Mars experts Hannah Kerner and Tanya Harrison to build a machine learning pipeline that can detect these features on a planetary scale. Our initial results suggest that by using this pipeline, we can reduce the time and cost of mapping Martian surface features by several orders of magnitude.
Current approach
The current best crater map was created by hand and only includes craters with diameters ≥ 1 km. The planet-wide Robbins Crater Database (built using THEMIS daytime imagery at 100 m/pixel) contains 384,343 craters (Robbins and Hynek, 2012) and took about 4 years to complete. This crater map was a major contribution to the scientific community, but Mars is a dynamic planet and our maps need to be dynamic as well. By the time a multi-year mapping effort is completed, it’s in danger of being out of date.
Human mapping at this scale is also prone to limitations. First, the manual mapping process doesn’t scale well — crater count increases approximately exponentially with decreasing crater diameter (Robbins and Hynek, 2012). Second, existing mapping efforts are difficult to replicate as human mappers are unlikely to generate the same crater map twice. For craters that are significantly eroded or obscured, it’s hard to quantitatively instruct a person to be more or less conservative when mapping. Finally, craters are only one of many interesting surface features. It’s impractical to repeat the planet-wide mapping process by hand every time we need to map a new feature. We can mitigate these problems using state of the art methods from AI.
AI-based mapping
Deep learning — a popular subfield within AI — is a technique that can discern complex patterns in data. We developed an approach to map craters at sizes down to 100 meters in diameter using a deep learning model. While we focused specifically on detecting craters here, the same architecture we chose can be extended to map multiple categories of surface features, such as dunes or gullies.
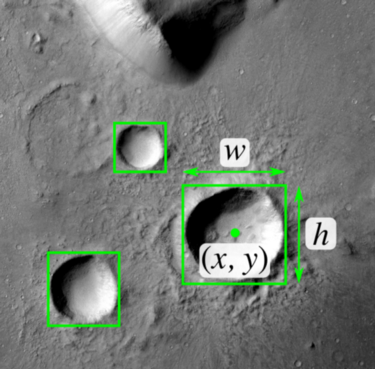
Example bounding box visualizations of detected craters. The YOLO model provides the center coordinates, width, and height of all craters it detects. We can estimate the diameter of these craters by averaging the width and height of each bounding box.
The specific architecture we selected is called You Only Look Once (YOLO; Redmon and Farhadi, 2018). YOLO is an open source object detection algorithm that predicts bounding boxes around objects of interest. We trained the model to analyze satellite images and generate bounding boxes around detected craters. The satellite images of Mars were taken by the ConText Camera (CTX) imager on the Mars Reconnaissance Orbiter (MRO) and the images are publicly available on NASA’s Planetary Data System (PDS).
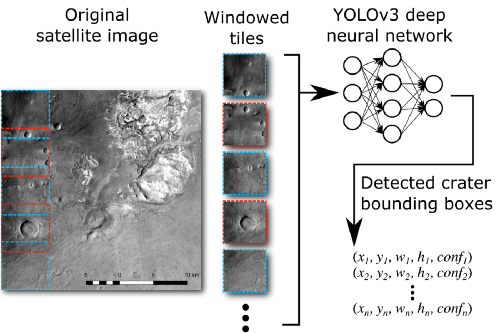
Data flow through the processing pipeline from input data, through prediction, to output bounding boxes. Left: Context images are sliced into overlapping 512x512-pixel tiles. Windows span multiple spatial resolutions so that both large and small craters are detectable. Right: The YOLO model takes the windowed tiles as input and proposes bounding boxes (defined by x, y position, width, height, and prediction confidence). In training, where the ground-truth bounding boxes are known, prediction errors are back-propagated through the network to tune the model. During prediction, we can vary the confidence threshold to tune how conservative the model’s predictions should be.
Results
Once the model was trained, we generated a crater map for several of the Mars 2020 rover candidate landing sites (NE Syrtis, Jezero, and Midway) as well as the area around the Curiosity rover (Gale Crater). Detailed information and imagery from the landing sites is available from the Murray Laboratory at Caltech.
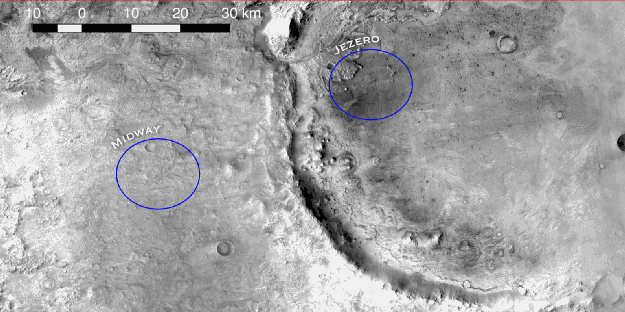
Crater map relevant for the Mars 2020 rover mission. The blue ellipses are two candidate landing zones for the upcoming Mars 2020 rover launch and green boxes represent detected craters. The Jezero landing site (right ellipse in this animation) was chosen in November 2018 after a thorough selection process.
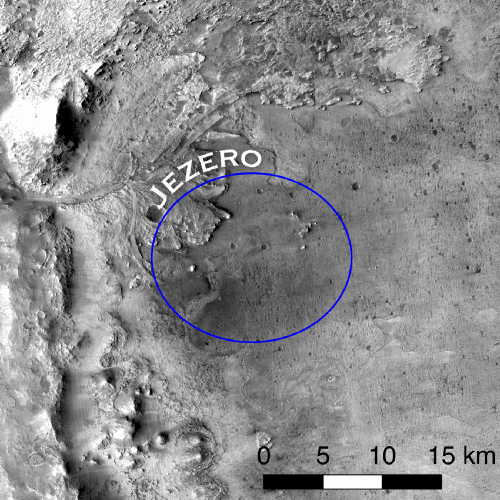
Craters mapped near the Jezero landing site within Jezero Crater. Evidence of a long dried up river delta lies just Northwest of the Jezero landing ellipse. The Mars 2020 rover will take soil samples in this area and search for signs of past microbial life.
In these target regions, we identified a total of 381,648 craters with diameters down to 100 m at a processing speed of approximately 20 km² per second. We ran the model on a single GPU cloud machine and achieved a maximum F1-score of 0.87, which is reasonably good performance for an object detection model. While the Robbin’s Database has many additional crater details (ejecta, depth, morphology, etc.), that’s a 10x improvement on crater resolution at a speed roughly 5 orders of magnitude faster.
Humans and robots mapping together
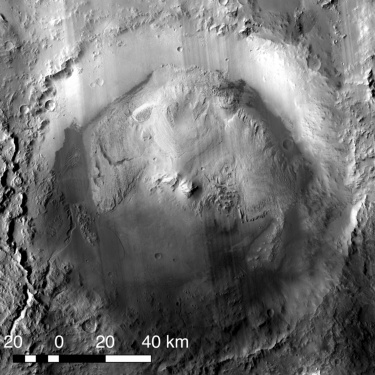
Curiosity rover and craters in Gale Crater. Detected craters are indicated by green boxes and the rover icon indicates Curiosity’s position in December 2018. Note that the actual rover is not visible in any of the CTX images as it is smaller than a single pixel.
While AI can help us map at the planetary scale, these techniques have some limitations. For example, our model misses some craters and falsely categorizes other circular features as craters. The best strategy will likely need to combine the speed of AI-based tools with the accuracy and flexibility of expert human mappers. Basically, we can use AI to propose a planet-wide surface feature map and then rely on humans to validate the predictions. We hope to give planetary researchers the ability to spend more time on mission planning and scientific analysis.
In the near future, we plan to bring expert validation into this pipeline so we can import these crater maps into the public Java Mission-planning and Analysis for Remote Sensing (JMARS) platform used by Mars mission planners and researchers. Our long term vision is an open and interactive map (à la OpenStreetMap) that explorers, scientists, and the general public can all use to better understand the surface of Mars.
下载开源日报APP:https://openingsource.org/2579/
加入我们:https://openingsource.org/about/join/
关注我们:https://openingsource.org/about/love/