每天推荐一个 GitHub 优质开源项目和一篇精选英文科技或编程文章原文,欢迎关注开源日报。交流QQ群:202790710;微博:https://weibo.com/openingsource;电报群 https://t.me/OpeningSourceOrg

今日推荐开源项目:《.NET 框架 Util》传送门:GitHub链接
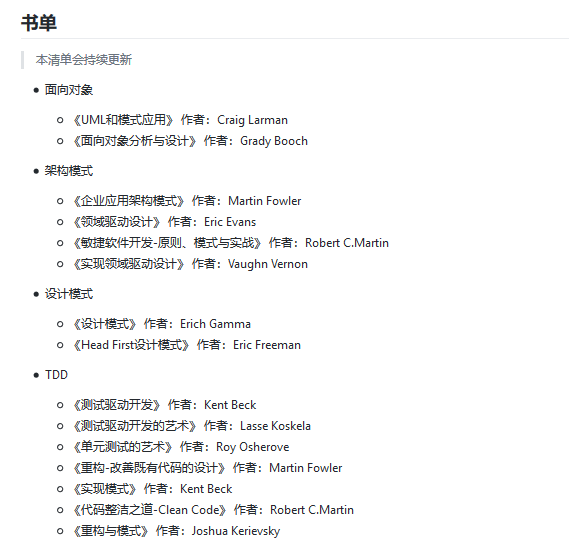
推荐理由:这个项目是作者自己积累出来的应用框架,发布出来是希望帮助那些已经有 .NET 基础的人能够搭建出自己的框架。这个项目中不仅介绍了框架的开发环境,还有一些开发流程和推荐给学习者的书单,非常适合使用 . NET 的朋友们来了解一下。
今日推荐英文原文:《Circular Audio Wave — JS Library for Audio Visualization in Circular Waveform》作者:Kelvin Au
推荐理由:这是作者制作的圆形音频波的 JS 库,可以根据音频改变形状
Circular Audio Wave — JS Library for Audio Visualization in Circular Waveform
Visualizing the data in a dynamic and continuous way gives the real-time feeling to be in sync with the data status, especially true for audio. I was looking for a JS library for circular audio wave, which was in a form of a circular continuous line that changed when the audio frequency changed, but I couldn’t find one. There is a great list of audio visualization libraries on github called awesome-audio-visualization. I couldn’t find anything that fit my need there. Therefore, I decided to create a library for this purpose.
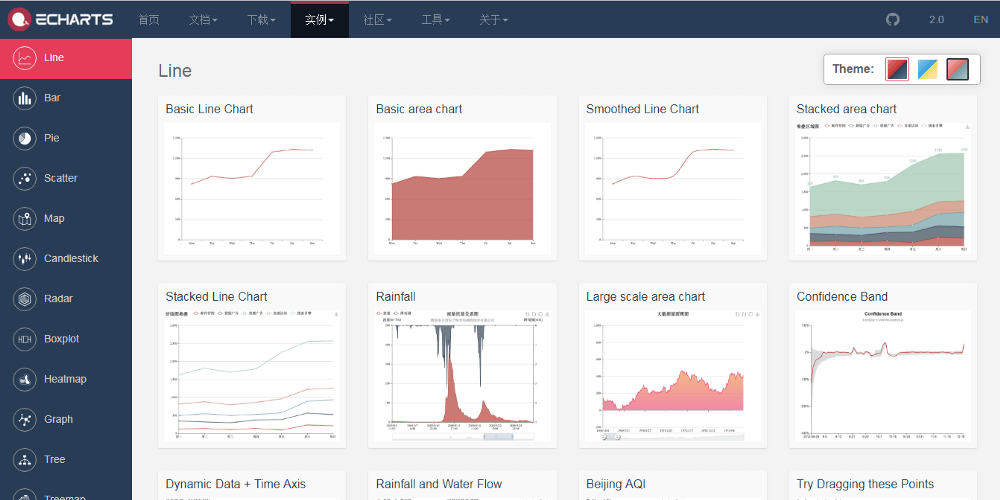
I have been using a great canvas charting library called ECharts, created by Baidu, for my current company. It is very powerful and easy to use, and suitable for big data rendering. It has a wide range of charts like line, bar, pie, scatter, etc.
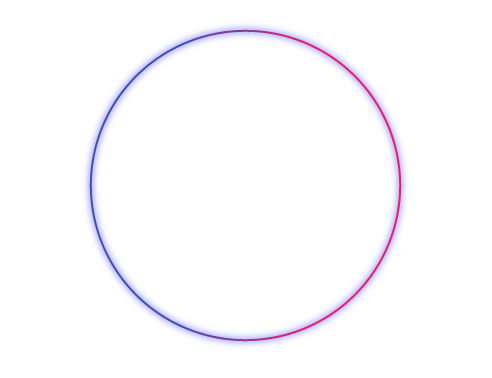
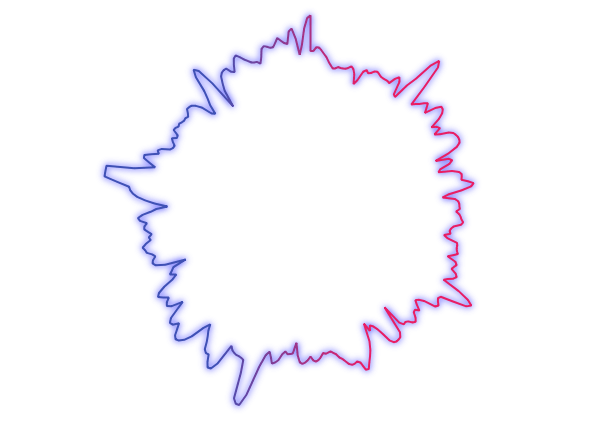
In order to make a circular continuous line, I took a look at the options of line chart. There’s a setting of the coordinate system — cartesian2d or polar. Polar was obviously the system I needed. I added data points with the same radius and incremental angle starting from 0 to 361. The reason of the 361st point was to fill the gap between 0th and 360th points. And it looked better with some color gradient on.
At this point, it could actually fulfill my initial purpose already, by feeding data into it using Web Audio API. The radius and angle would be the frequency level and index of the result from getByteFrequencyData(). That just seemed too easy.
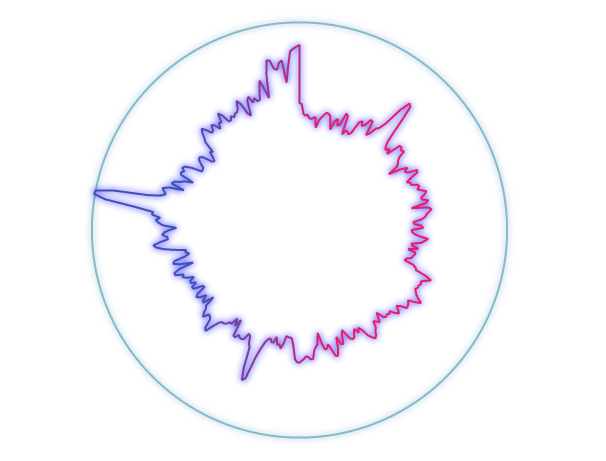
I thought there could be more that I could do, so I researched on existing audio reactive visualization. There’s one common feature that I could add — maximum frequency bar (I called it “max bar”).The max bar records the maximum frequency and acts as a ceiling. Its record gradually decreases over time, until a current frequency that’s higher than the record appears, then it will use the higher frequency as a new ceiling. This helps visualize the difference of the frequency level from the recent maximum.
A max bar, acting as a ceiling, would be another circular line except that it’s always in a smooth shape. I added another polar line chart with the logic described above, rendered in greenish blue.
There was a lot of empty space at the center. It could be used to display more information about the audio. There’s also one more attribute of the audio that’s commonly used — tempo. I found José M. Pérez’s research about tempo detection in JavaScript, which would be the feature I wanted. However, I didn’t want to put a text there and showed the current bpm (beat per minute). That would not match my purpose of audio visualization. So I used another chart type for this — EffectScatter.
EffectScatter is a scatter chart that provides ripple effect to the data points. I added one big data point at the center, added ripple effect to it with gradient color. The speed of the ripple is based on the tempo of the audio. Here is the final result.
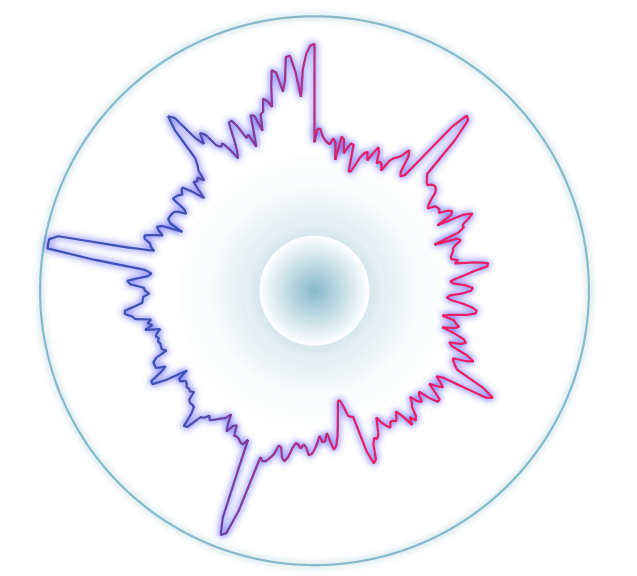
This looked great to me after adding the rippling point. I was satisfied with this design. It provided the information of the frequency levels at different data point and tempo of the audio.
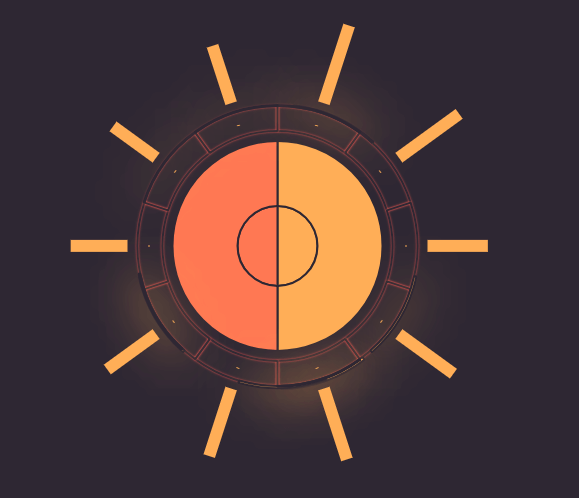
I also tried it with another chart type sunburst. It’s supposed to be label text for the outermost layer, but that’s what I didn’t want. Thus I put empty string into there and add background color to these text so it looks like bars.
This library is not supported for IE, because they don’t have Web Audio API. The source code of this library is on Github.
每天推荐一个 GitHub 优质开源项目和一篇精选英文科技或编程文章原文,欢迎关注开源日报。交流QQ群:202790710;微博:https://weibo.com/openingsource;电报群 https://t.me/OpeningSourceOrg