每天推荐一个 GitHub 优质开源项目和一篇精选英文科技或编程文章原文,欢迎关注开源日报。交流QQ群:202790710;微博:https://weibo.com/openingsource;电报群 https://t.me/OpeningSourceOrg

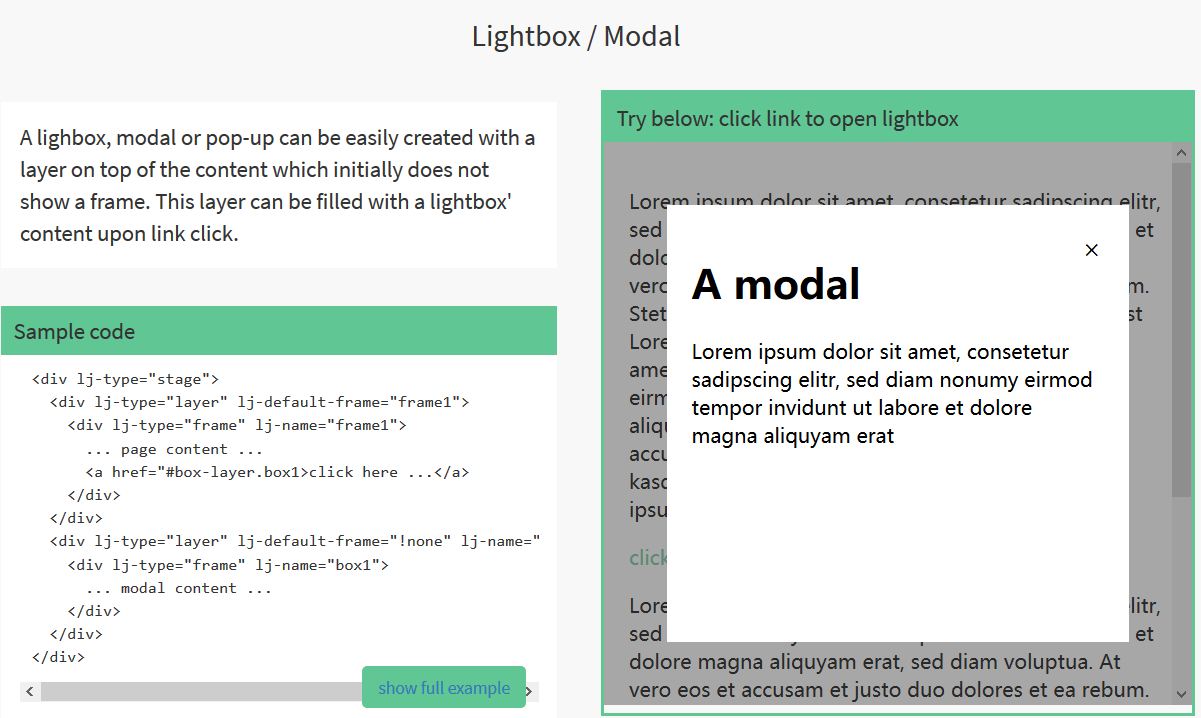
今日推荐开源项目:《加特技的交互 layerJS》GitHub链接
推荐理由:这个JS库可以让用户在和你的网页交互时具有更好的特效,它给你提供了诸如滑条和画布型 UI 这样的交互方法,你只需要把网站上的内容放进去,它就可以帮你完成剩下有关于交互的工作。它能够在电脑上也发挥它的交互作用,也能够与现有的框架诸如 Angular, VueJS, React, jQuery 等一起使用,这一点还是不用担心的。它在官网上也提供了例子,让初学者也可以照葫芦画瓢的去使用。
今日推荐英文原文:《Python for Data Science: 8 Concepts You May Have Forgotten》作者:Conor Dewey
推荐理由:这篇文章介绍了在数据科学中你可能经常用到但是老是忘的8个概念,实际上即使你不玩数据科学,在日常中你兴许也会用到比如 Map 或者 Lambda 这样简单好用的功能,推荐给使用 Python 的朋友一读
Python for Data Science: 8 Concepts You May Have Forgotten
The Problem
If you’ve ever found yourself looking up the same question, concept, or syntax over and over again when programming, you’re not alone.
I find myself doing this constantly.
While it’s not unnatural to look things up on StackOverflow or other resources, it does slow you down a good bit and raise questions as to your complete understanding of the language.
We live in a world where there is a seemingly infinite amount of accessible, free resources looming just one search away at all times. However, this can be both a blessing and a curse. When not managed effectively, an over-reliance on these resources can build poor habits that will set you back long-term.

Personally, I find myself pulling code from similar discussion threads several times, rather than taking the time to learn and solidify the concept so that I can reproduce the code myself the next time.
This approach is lazy and while it may be the path of least resistance in the short-term, it will ultimately hurt your growth, productivity, and ability to recall syntax (cough, interviews) down the line.
The Goal
Recently, I’ve been working through an online data science course titled Python for Data Science and Machine Learning on Udemy (Oh God, I sound like that guy on Youtube). Over the early lectures in the series, I was reminded of some concepts and syntax that I consistently overlook when performing data analysis in Python.
In the interest of solidifying my understanding of these concepts once and for all and saving you guys a couple of StackOverflow searches, here’s the stuff that I’m always forgetting when working with Python, NumPy, and Pandas.
I’ve included a short description and example for each, however for your benefit, I will also include links to videos and other resources that explore each concept more in-depth as well.
One-Line List Comprehension
Writing out a for loop every time you need to define some sort of list is tedious, luckily Python has a built-in way to address this problem in just one line of code. The syntax can be a little hard to wrap your head around but once you get familiar with this technique you’ll use it fairly often.
See the example above and below for how you would normally go about list comprehension with a for loop vs. creating your list with in one simple line with no loops necessary.
x = [1,2,3,4]
out = []
for item in x:
    out.append(item**2)
print(out)
[1, 4, 9, 16]
# vs.
x = [1,2,3,4]
out = [item**2 for item in x]
print(out)
[1, 4, 9, 16]
Lambda Functions
Ever get tired of creating function after function for limited use cases? Lambda functions to the rescue! Lambda functions are used for creating small, one-time and anonymous function objects in Python. Basically, they let you create a function, without creating a function.
The basic syntax of lambda functions is:
lambda arguments: expression
Note that lambda functions can do everything that regular functions can do, as long as there’s just one expression. Check out the simple example below and the upcoming video to get a better feel for the power of lambda functions:
double = lambda x: x * 2
print(double(5))
10
Map and Filter
Once you have a grasp on lambda functions, learning to pair them with the map and filter functions can be a powerful tool.
Specifically, map takes in a list and transforms it into a new list by performing some sort of operation on each element. In this example, it goes through each element and maps the result of itself times 2 to a new list. Note that the list function simply converts the output to list type.
# Map
seq = [1, 2, 3, 4, 5]
result = list(map(lambda var: var*2, seq))
print(result)
[2, 4, 6, 8, 10]
The filter function takes in a list and a rule, much like map, however it returns a subset of the original list by comparing each element against the boolean filtering rule.
# Filter
seq = [1, 2, 3, 4, 5]
result = list(filter(lambda x: x > 2, seq))
print(result)
[3, 4, 5]
Arange and Linspace
For creating quick and easy Numpy arrays, look no further than the arange and linspace functions. Each one has their specific purpose, but the appeal here (instead of using range), is that they output NumPy arrays, which are typically easier to work with for data science.
Arange returns evenly spaced values within a given interval. Along with a starting and stopping point, you can also define a step size or data type if necessary. Note that the stopping point is a ‘cut-off’ value, so it will not be included in the array output.
# np.arange(start, stop, step)
np.arange(3, 7, 2)
array([3, 5])
Linspace is very similar, but with a slight twist. Linspace returns evenly spaced numbers over a specified interval. So given a starting and stopping point, as well as a number of values, linspace will evenly space them out for you in a NumPy array. This is especially helpful for data visualizations and declaring axes when plotting.
# np.linspace(start, stop, num)
np.linspace(2.0, 3.0, num=5)
array([ 2.0, 2.25, 2.5, 2.75, 3.0])
What Axis Really Means
You may have ran into this when dropping a column in Pandas or summing values in NumPy matrix. If not, then you surely will at some point. Let’s use the example of dropping a column for now:
df.drop('Column A', axis=1)
df.drop('Row A', axis=0)
I don’t know how many times I wrote this line of code before I actually knew why I was declaring axis what I was. As you can probably deduce from above, set axis to 1 if you want to deal with columns and set it to 0 if you want rows. But why is this? My favorite reasoning, or atleast how I remember this:
df.shape
(# of Rows, # of Columns)
Calling the shape attribute from a Pandas dataframe gives us back a tuple with the first value representing the number of rows and the second value representing the number of columns. If you think about how this is indexed in Python, rows are at 0 and columns are at 1, much like how we declare our axis value. Crazy, right?
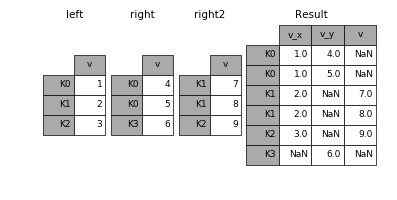
Concat, Merge, and Join
If you’re familiar with SQL, then these concepts will probably come a lot easier for you. Anyhow, these functions are essentially just ways to combine dataframes in specific ways. It can be difficult to keep track of which is best to use at which time, so let’s review it.
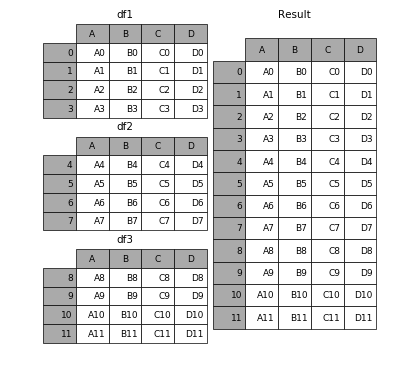
Concat allows the user to append one or more dataframes to each other either below or next to it (depending on how you define the axis).
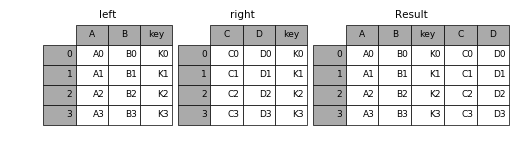
Merge combines multiple dataframes on specific, common columns that serve as the primary key.
Join, much like merge, combines two dataframes. However, it joins them based on their indices, rather than some specified column.
Check out the excellent Pandas documentation for specific syntax and more concrete examples, as well as some special cases that you may run into.
Pandas Apply
Think of apply as a map function, but made for Pandas DataFrames or more specifically, for Series. If you’re not as familiar, Series are pretty similar to NumPy arrays for the most part.
Apply sends a function to every element along a column or row depending on what you specify. You might imagine how useful this can be, especially for formatting and manipulating values across a whole DataFrame column, without having to loop at all.
Pivot Tables
Last but certainly not least is pivot tables. If you’re familiar with Microsoft Excel, then you’ve probably heard of pivot tables in some respect. The Pandas built-in pivot_table function creates a spreadsheet-style pivot table as a DataFrame. Note that the levels in the pivot table are stored in MultiIndex objects on the index and columns of the resulting DataFrame.
Wrapping up
That’s it for now. I hope a couple of these overviews have effectively jogged your memory regarding important yet somewhat tricky methods, functions, and concepts you frequently encounter when using Python for data science. Personally, I know that even the act of writing these out and trying to explain them in simple terms has helped me out a ton.
If you’re interested in receiving my weekly rundown of interesting articles and resources focused on data science, machine learning, and artificial intelligence, then subscribe to Self Driven Data Science using the form below!
每天推荐一个 GitHub 优质开源项目和一篇精选英文科技或编程文章原文,欢迎关注开源日报。交流QQ群:202790710;微博:https://weibo.com/openingsource;电报群 https://t.me/OpeningSourceOrg