每天推荐一个 GitHub 优质开源项目和一篇精选英文科技或编程文章原文,欢迎关注开源日报。交流QQ群:202790710;电报群 https://t.me/OpeningSourceOrg

今日推荐开源项目:《后端设计模式指南 Awesome Scalability》GitHub地址
推荐理由:本项目提供了大量精选的阅读材料,旨在帮助后台开发者们能够借助项目中各个文献的思路做出一个具有延展性,可用性,稳定性的后台。这个概念虽然模糊,但是借由著名工程师(Martin Fowler,Robert C. Martin,Tom White等)和高质量资源(highscalability.com,infoq.com等)的诠释,相信大家能从中理解并学到有用的东西。

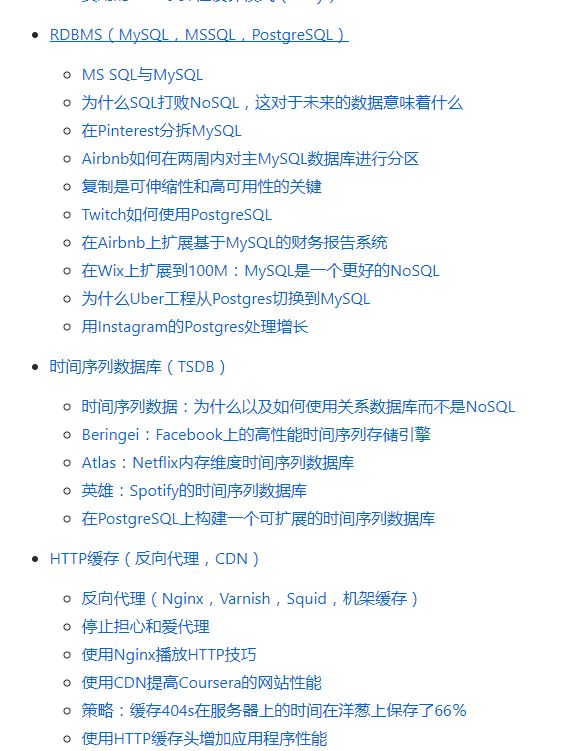
项目将各类文献整理,涵盖各个方面。主要分为原则、可扩展性、稳定性、其他方面、会谈、图书七个板块。包括了异常处理,数据库策略等内容。
项目欢迎有意者的参与,贡献是非常受欢迎的!有兴趣的朋友可以一试。
今日推荐英文原文:《3 useful things you can do with the IP tool in Linux》作者:
原文链接:https://opensource.com/article/18/5/useful-things-you-can-do-with-IP-tool-Linux
推荐理由:IP 工具是 GNU/Linux 系统中非常常用的一个命令,怎么用它查看你的ip地址,路由表呢?
3 useful things you can do with the IP tool in Linux
It has been more than a decade since the ifconfig command has been deprecated on Linux in favor of the iproute2 project, which contains the magical tool ip. Many online tutorial resources still refer to old command-line tools like ifconfig, route, and netstat. The goal of this tutorial is to share some of the simple networking-related things you can do easily using the ip tool instead.
Find your IP address
[snip]
44: wlp4s0: <BROADCAST,MULTICAST,UP,LOWER_UP> mtu 1500 qdisc mq state UP group default qlen 1000
link/ether 5c:e0:c5:c7:f0:f1 brd ff:ff:ff:ff:ff:ff
inet 10.16.196.113/23 brd 10.16.197.255 scope global dynamic wlp4s0
valid_lft 74830sec preferred_lft 74830sec
inet6 fe80::5ee0:c5ff:fec7:f0f1/64 scope link
valid_lft forever preferred_lft forever
ip addr show will show you a lot of information about all of your network link devices. In this case, my wireless Ethernet card (wlp4s0) is the IPv4 address (the inet field) 10.16.196.113/23. The /23 means that there are 23 bits of the 32 bits in the IP address, which will be shared by all of the IP addresses in this subnet. IP addresses in the subnet will range from 10.16.196.0 to 10.16.197.254. The broadcast address for the subnet (the brd field after the IP address) 10.16.197.255 is reserved for broadcast traffic to all hosts on the subnet.
We can show only the information about a single device using ip addr show dev wlp4s0, for example.
Display your routing table
default via 10.16.197.254 dev wlp4s0 proto static metric 600
10.16.196.0/23 dev wlp4s0 proto kernel scope link src 10.16.196.113 metric 601
192.168.122.0/24 dev virbr0 proto kernel scope link src 192.168.122.1 linkdown
The routing table is the local host's way of helping network traffic figure out where to go. It contains a set of signposts, sending traffic to a specific interface, and a specific next waypoint on its journey.
If you run any virtual machines or containers, these will get their own IP addresses and subnets, which can make these routing tables quite complicated, but in a single host, there are typically two instructions. For local traffic, send it out onto the local Ethernet, and the network switches will figure out (using a protocol called ARP) which host owns the destination IP address, and thus where the traffic should be sent. For traffic to the internet, send it to the local gateway node, which will have a better idea how to get to the destination.
In the situation above, the first line represents the external gateway for external traffic, the second line is for local traffic, and the third is reserved for a virtual bridge for VMs running on the host, but this link is not currently active.
Monitor your network configuration
[dneary@host]$ ip -s link list wlp4s0
The ip monitor command can be used to monitor changes in routing tables, network addressing on network interfaces, or changes in ARP tables on the local host. This command can be particularly useful in debugging network issues related to containers and networking, when two VMs should be able to communicate with each other but cannot.
When used with all, ip monitor will report all changes, prefixed with one of [LINK] (network interface changes), [ROUTE] (changes to a routing table), [ADDR] (IP address changes), or [NEIGH] (nothing to do with horses—changes related to ARP addresses of neighbors).You can also monitor changes on specific objects (for example, a specific routing table or an IP address).
Another useful option that works with many commands is ip -s, which gives some statistics. Adding a second -s option adds even more statistics. ip -s link list wlp4s0 above will give lots of information about packets received and transmitted, with the number of packets dropped, errors detected, and so on.
Handy tip: Shorten your commands
In general, for the ip tool, you need to include only enough letters to uniquely identify what you want to do. Instead of ip monitor, you can use ip mon. Instead of ip addr list, you can use ip a l, and you can use ip r in place of ip route. Ip link list can be shorted to ip l ls. To read about the many options you can use to change the behavior of a command, visit the ip manpage.
每天推荐一个 GitHub 优质开源项目和一篇精选英文科技或编程文章原文,欢迎关注开源日报。交流QQ群:202790710;电报群 https://t.me/OpeningSourceOrg
